
Surface Texture Depth after Re-Surfacing
An exploration of the road surfacing Texture Depth achieved after re-surfacing with various types of surface materials.

We have been comparing the results of a Cassandra Domain Model that we are working on with observed historical data. I am using the comparison graphs shown in my previous post. More work is needed here but generally I am happy with the outcomes.
One parameter that drew my attention was the predicted road surface Texture depth after a Re-Surfacing treatment. It seemed that the model consistently under-predicted the achieved Texture depth in the year after treatment. So I have been doing a deep-dive on this data to explore it in more detail - and in this post I will share some of my first impressions and observations with you.
Below is a graph showing the Texture depth achieved after a re-surfacing treatment for different surfacing types. Note that this data represents the mean of the left wheel-path Texture depth for the treatment length. Numbers shown on the right-hand side represent the number of observations in the group.
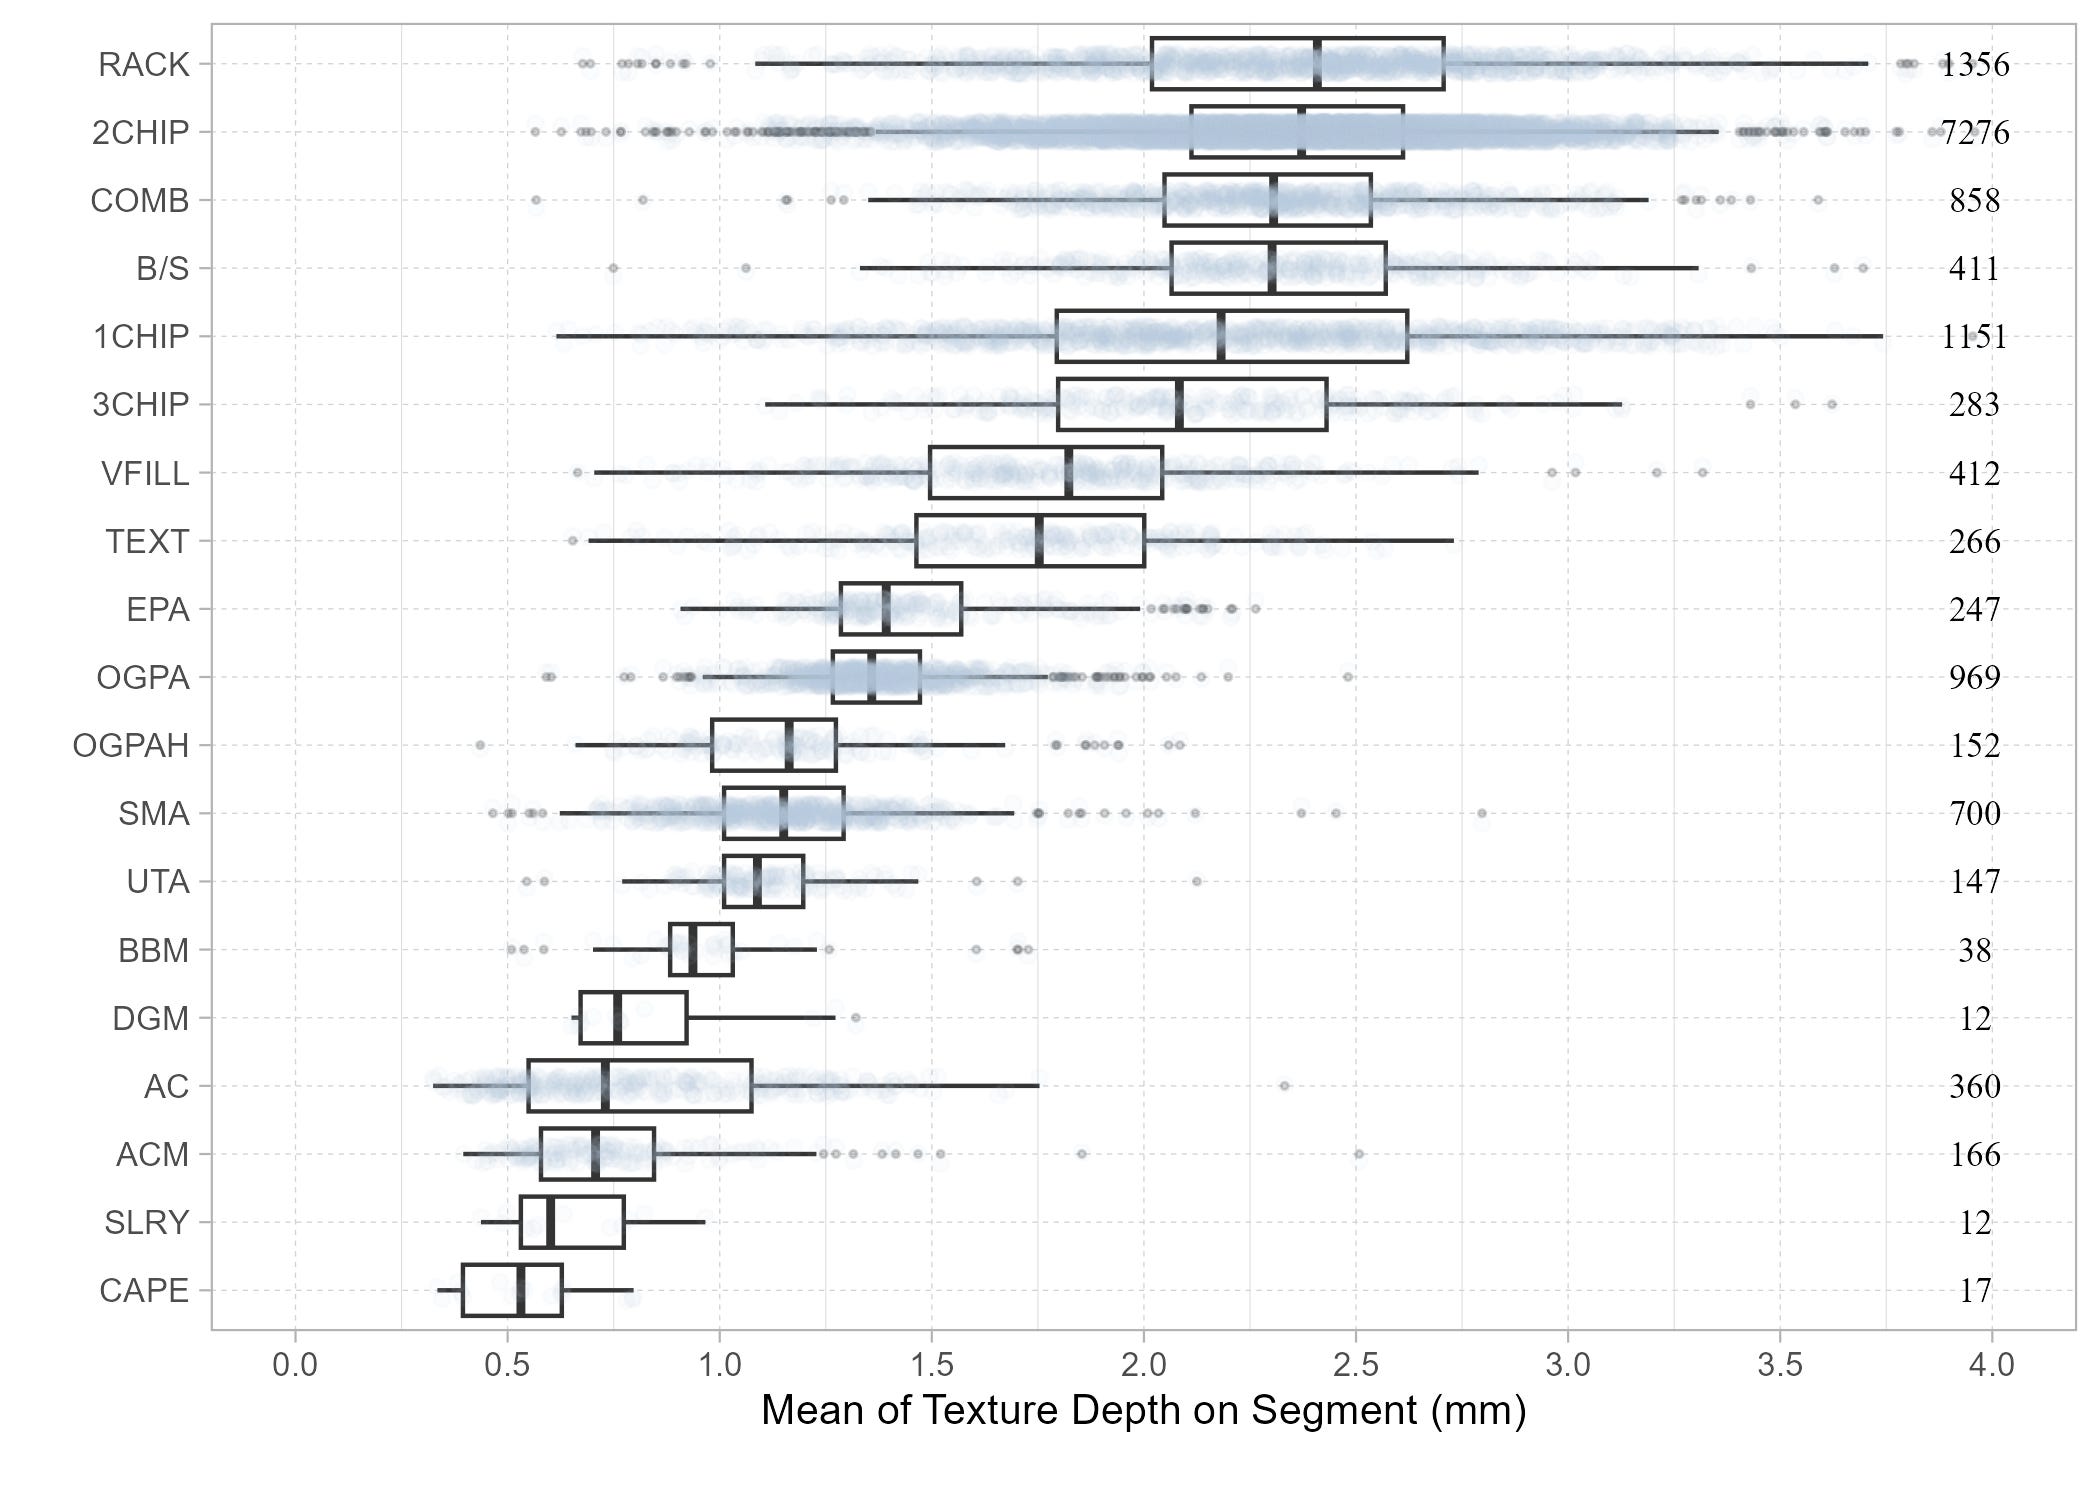
The data set I am working with was carefully curated and represents historical data from New Zealand State Highways collected approximately the last decade. The Texture depths used represent the measured Texture depth in the first survey after treatment. As expected, the graph shows that the Chip-Seal surfacing types have a higher Texture Depth after treatment compared to the Asphalt surfacing types.
I explored different Machine Learning models to see if I could improve the predictions for Texture depth after treatment. The Cassandra Domain Model we are currently building uses machine learning models built with the Microsoft ML.NET framework, but for this analysis I just explored the data using a Random Forest model in the “Ranger” package, using R and R-Studio.
With this package, I can explore the relative importance of different predictor variables (i.e. “features”) for making predictions. The graph below shows the relative importance of different features in determining the Texture depth after treatment.
Note that all of the features shown - except for ‘TreatmentMaterial’ represent data measured the year BEFORE treatment. Thus, for example, the feature “SurfaceThicknessTopLayer” represents the thickness of the surfacing before the treatment was placed. Similarly “TextureMean” represents the mean Texture depth in the year before the treatment was placed.
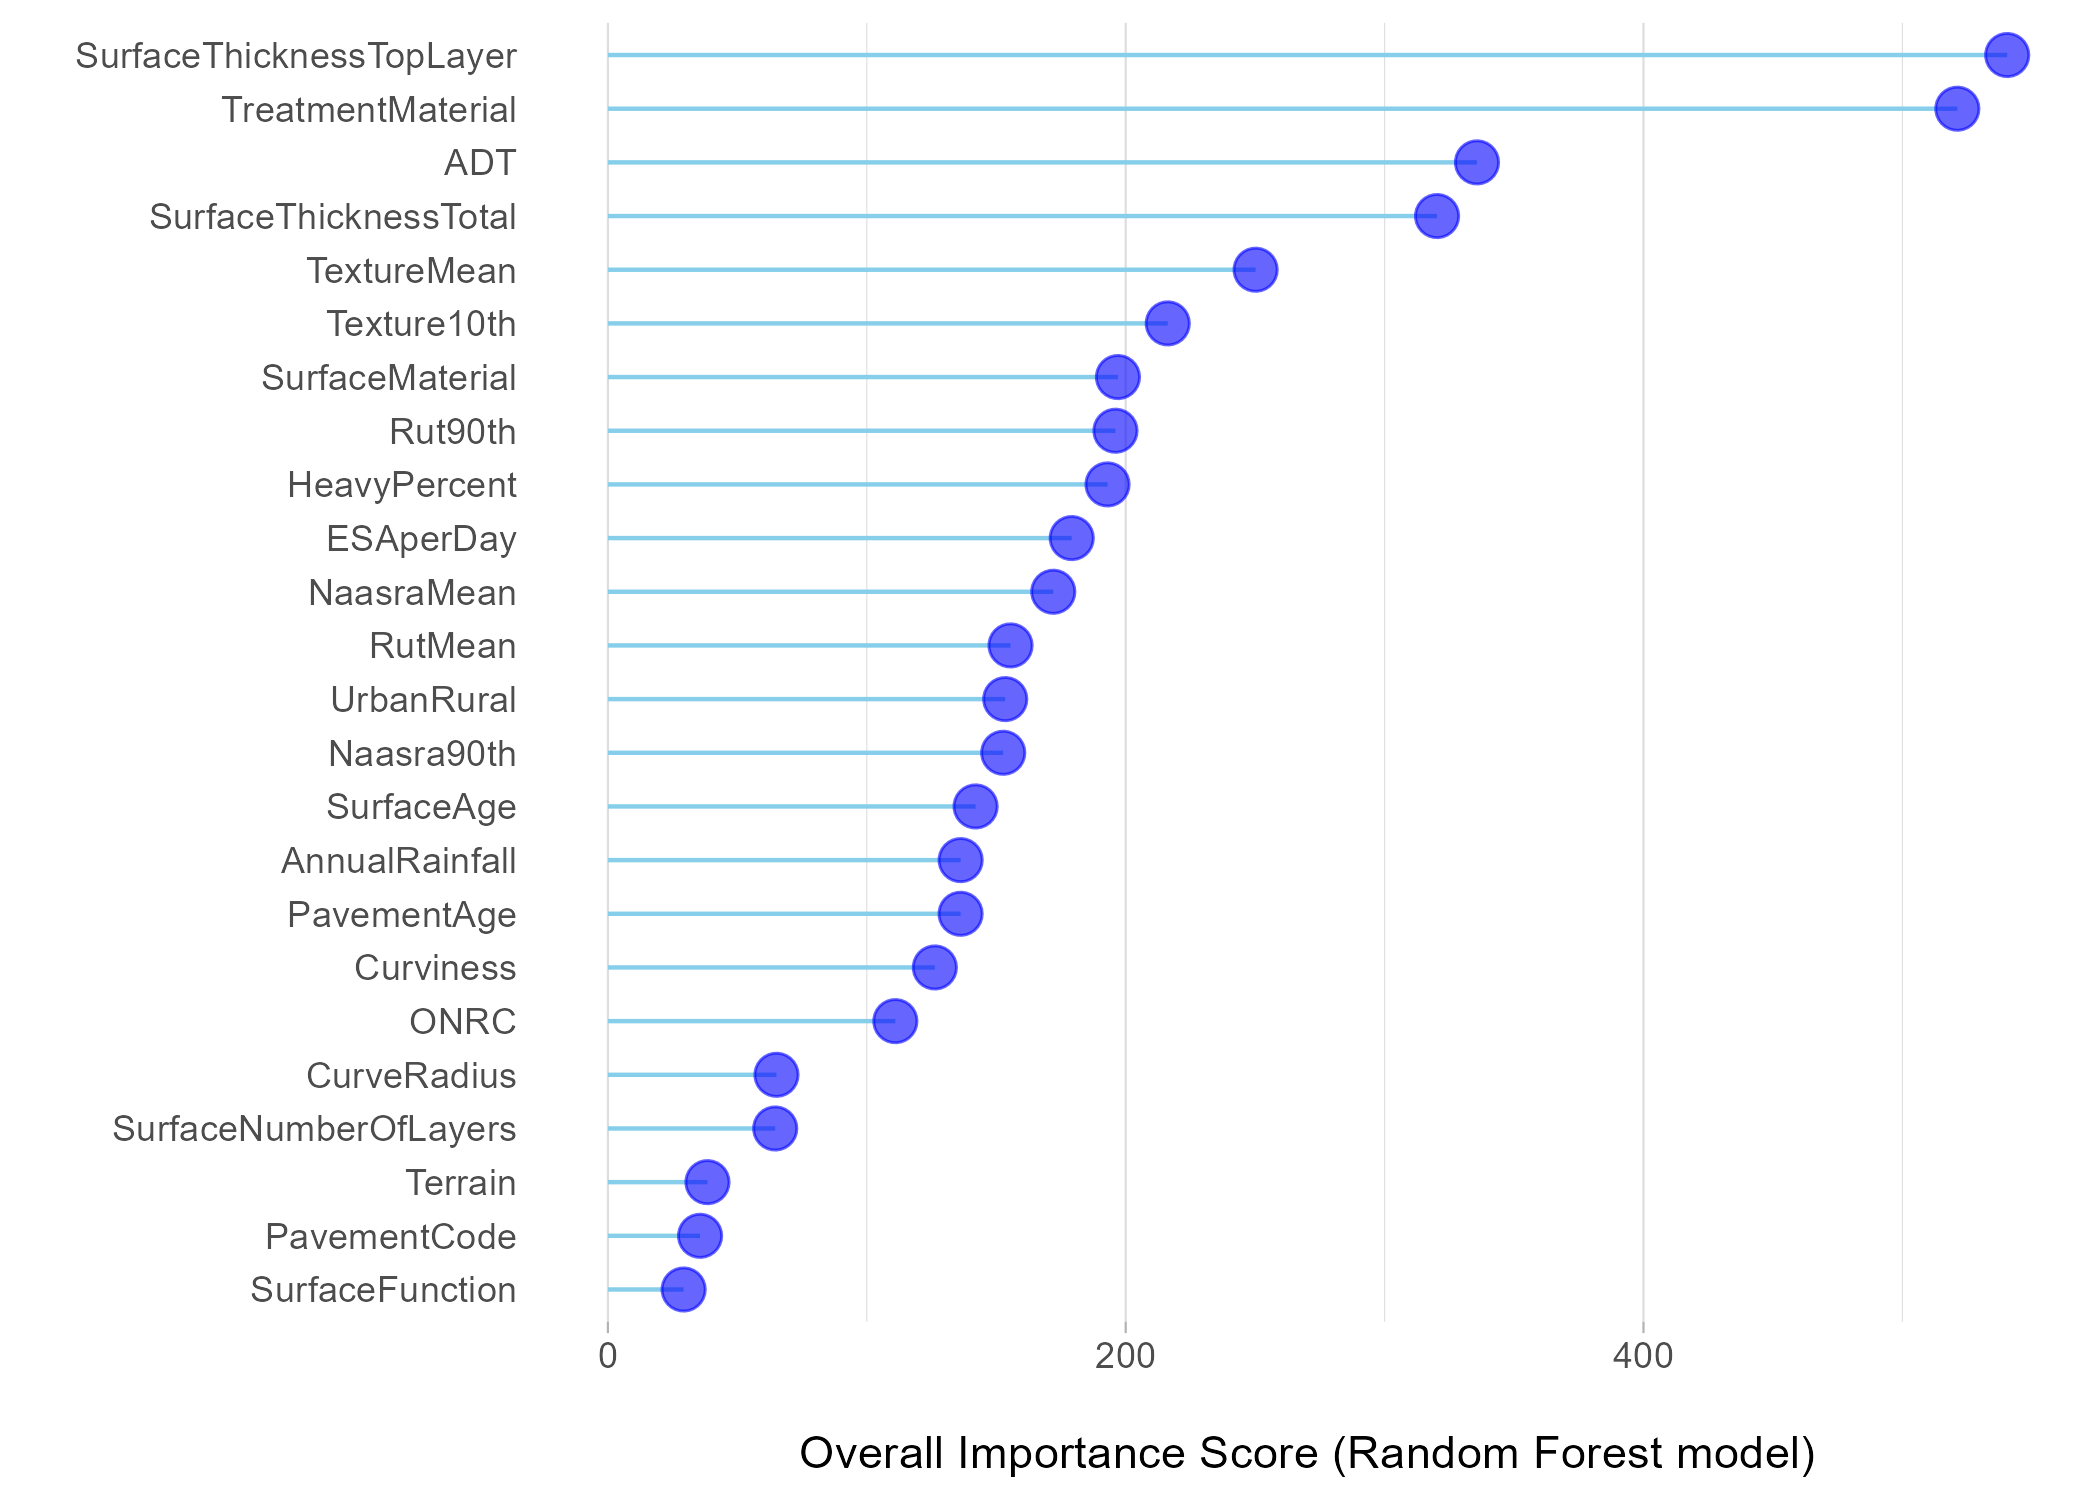
The Random Forest model suggests that the Surfacing Type (represented by feature ‘TreatmentMaterial’) together with the thickness of the surfacing (feature “SurfaceThicknessTopLayer”) and the ADT are the three most influential features that play a role in determining the Texture depth after treatment.
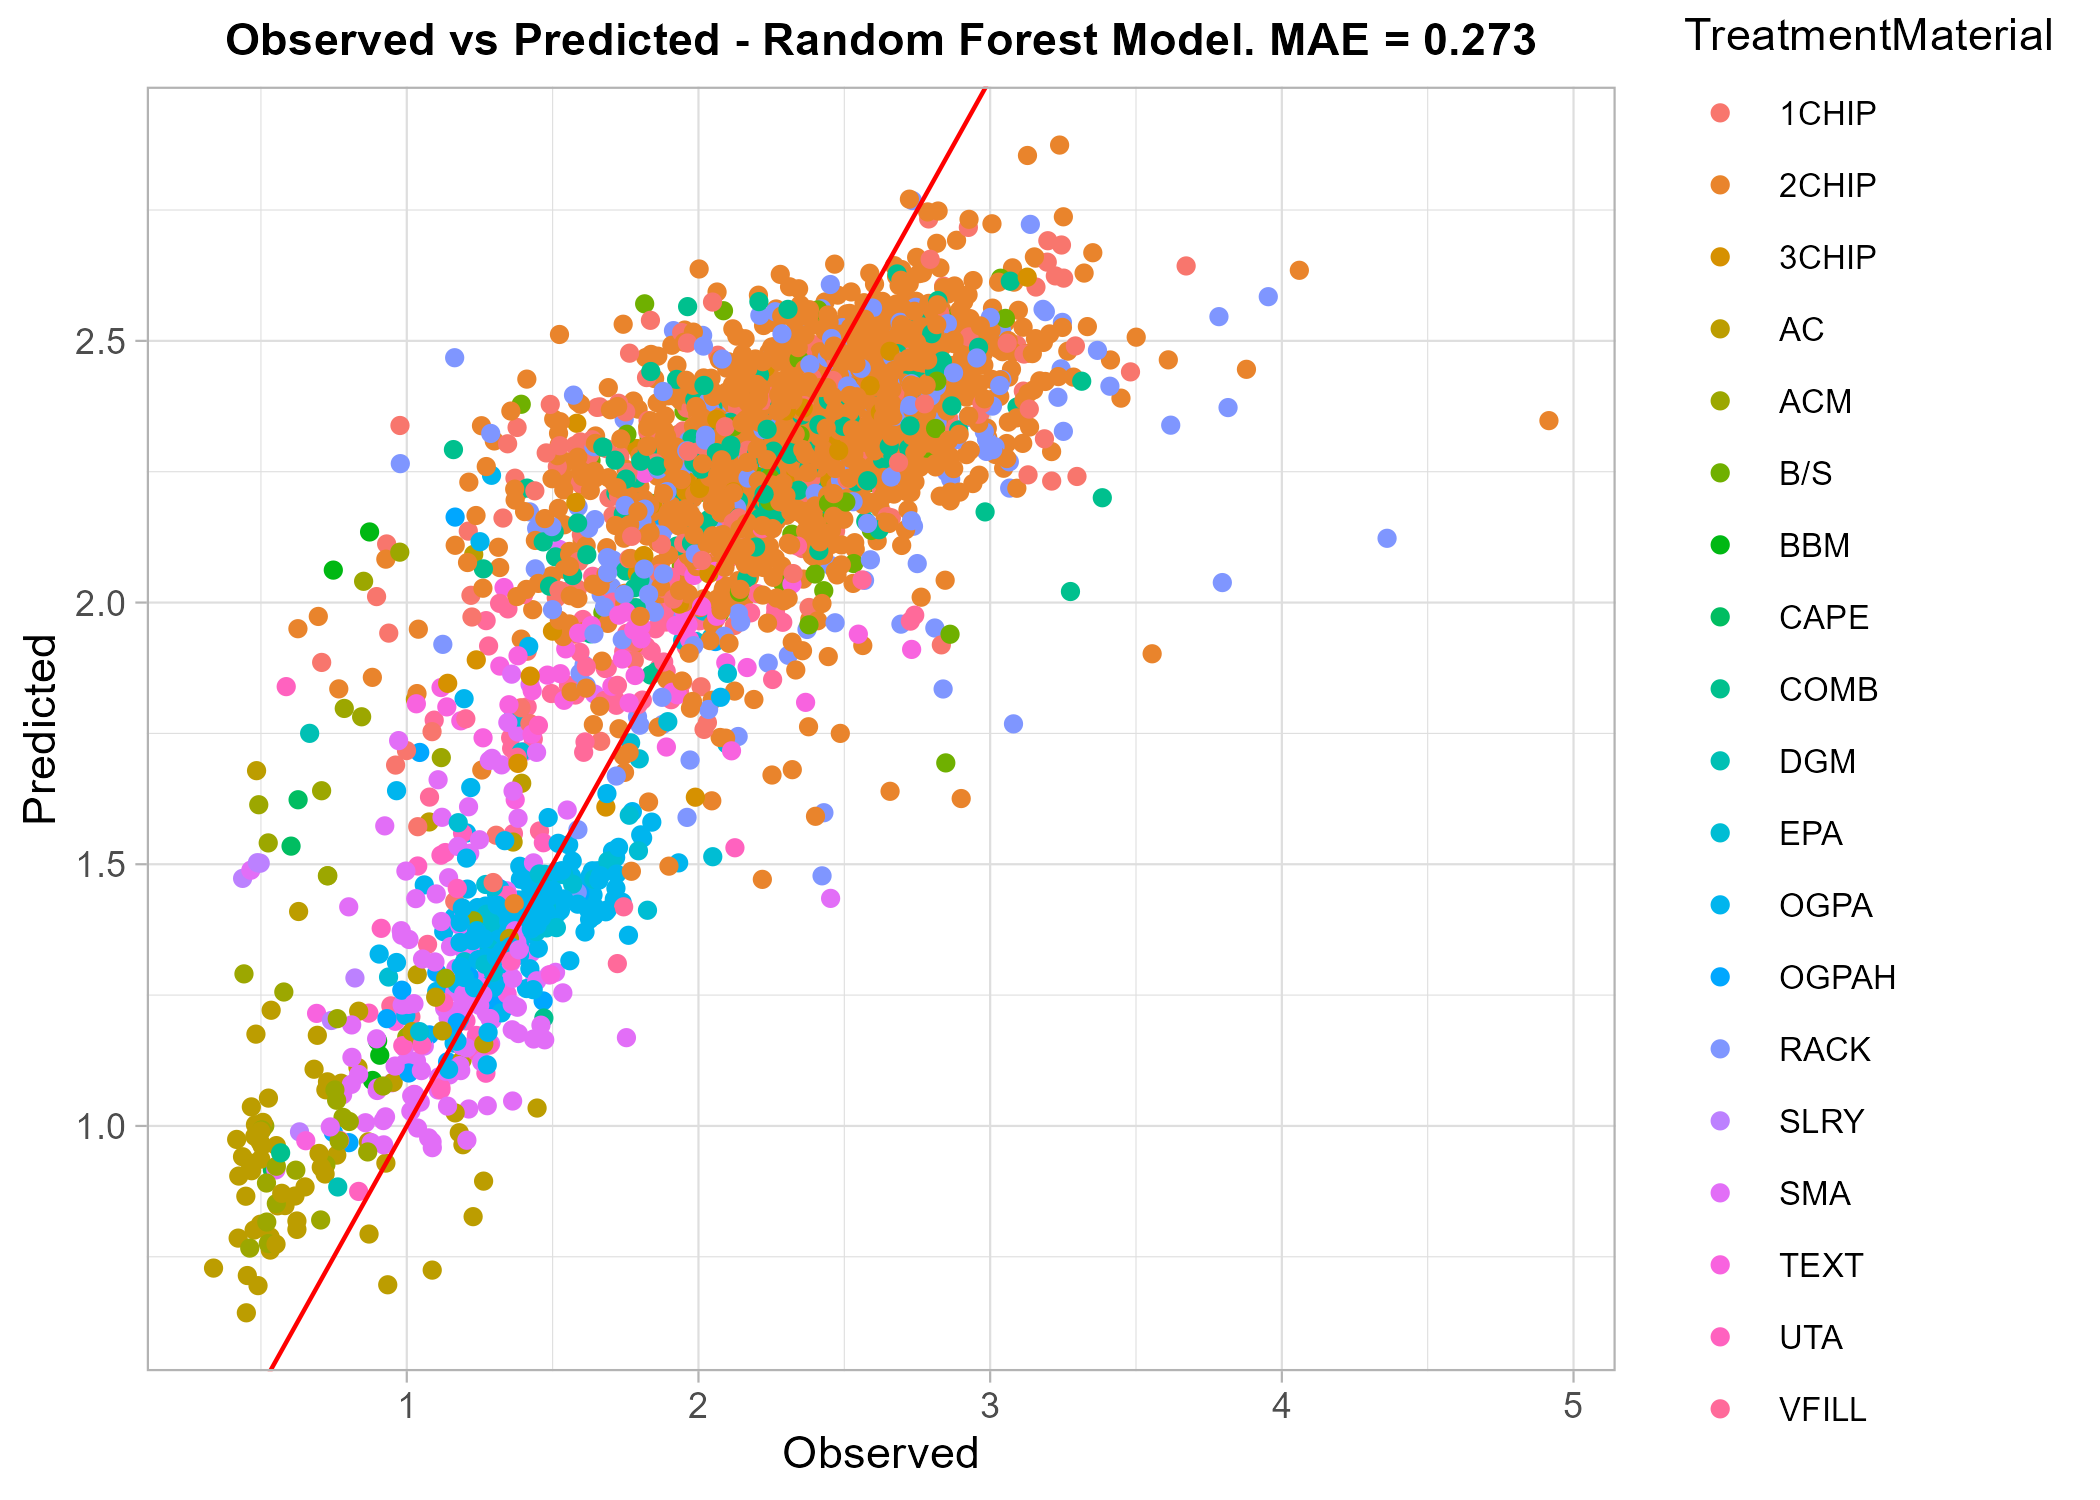
The graph below shows the observed versus predicted Texture depth after treatment using the Random Forest model. Note that these predictions are made on a holdout test set - that is, a set of data that was not included when the model was trained. Thus, the graph below gives an honest representation of the type of accuracy that can be expected from the model.
Given the strong dependence of Texture depth on the surfacing type, we can also build a much simpler “model” by just applying the Mean Texture depth after treatment observed for each Surface Type. Thus, a simple lookup table in which we assign the Texture depth after treatment based on the mean achieved for the surface treatment type. This “one-variable” model yields the following results on a holdout test set:
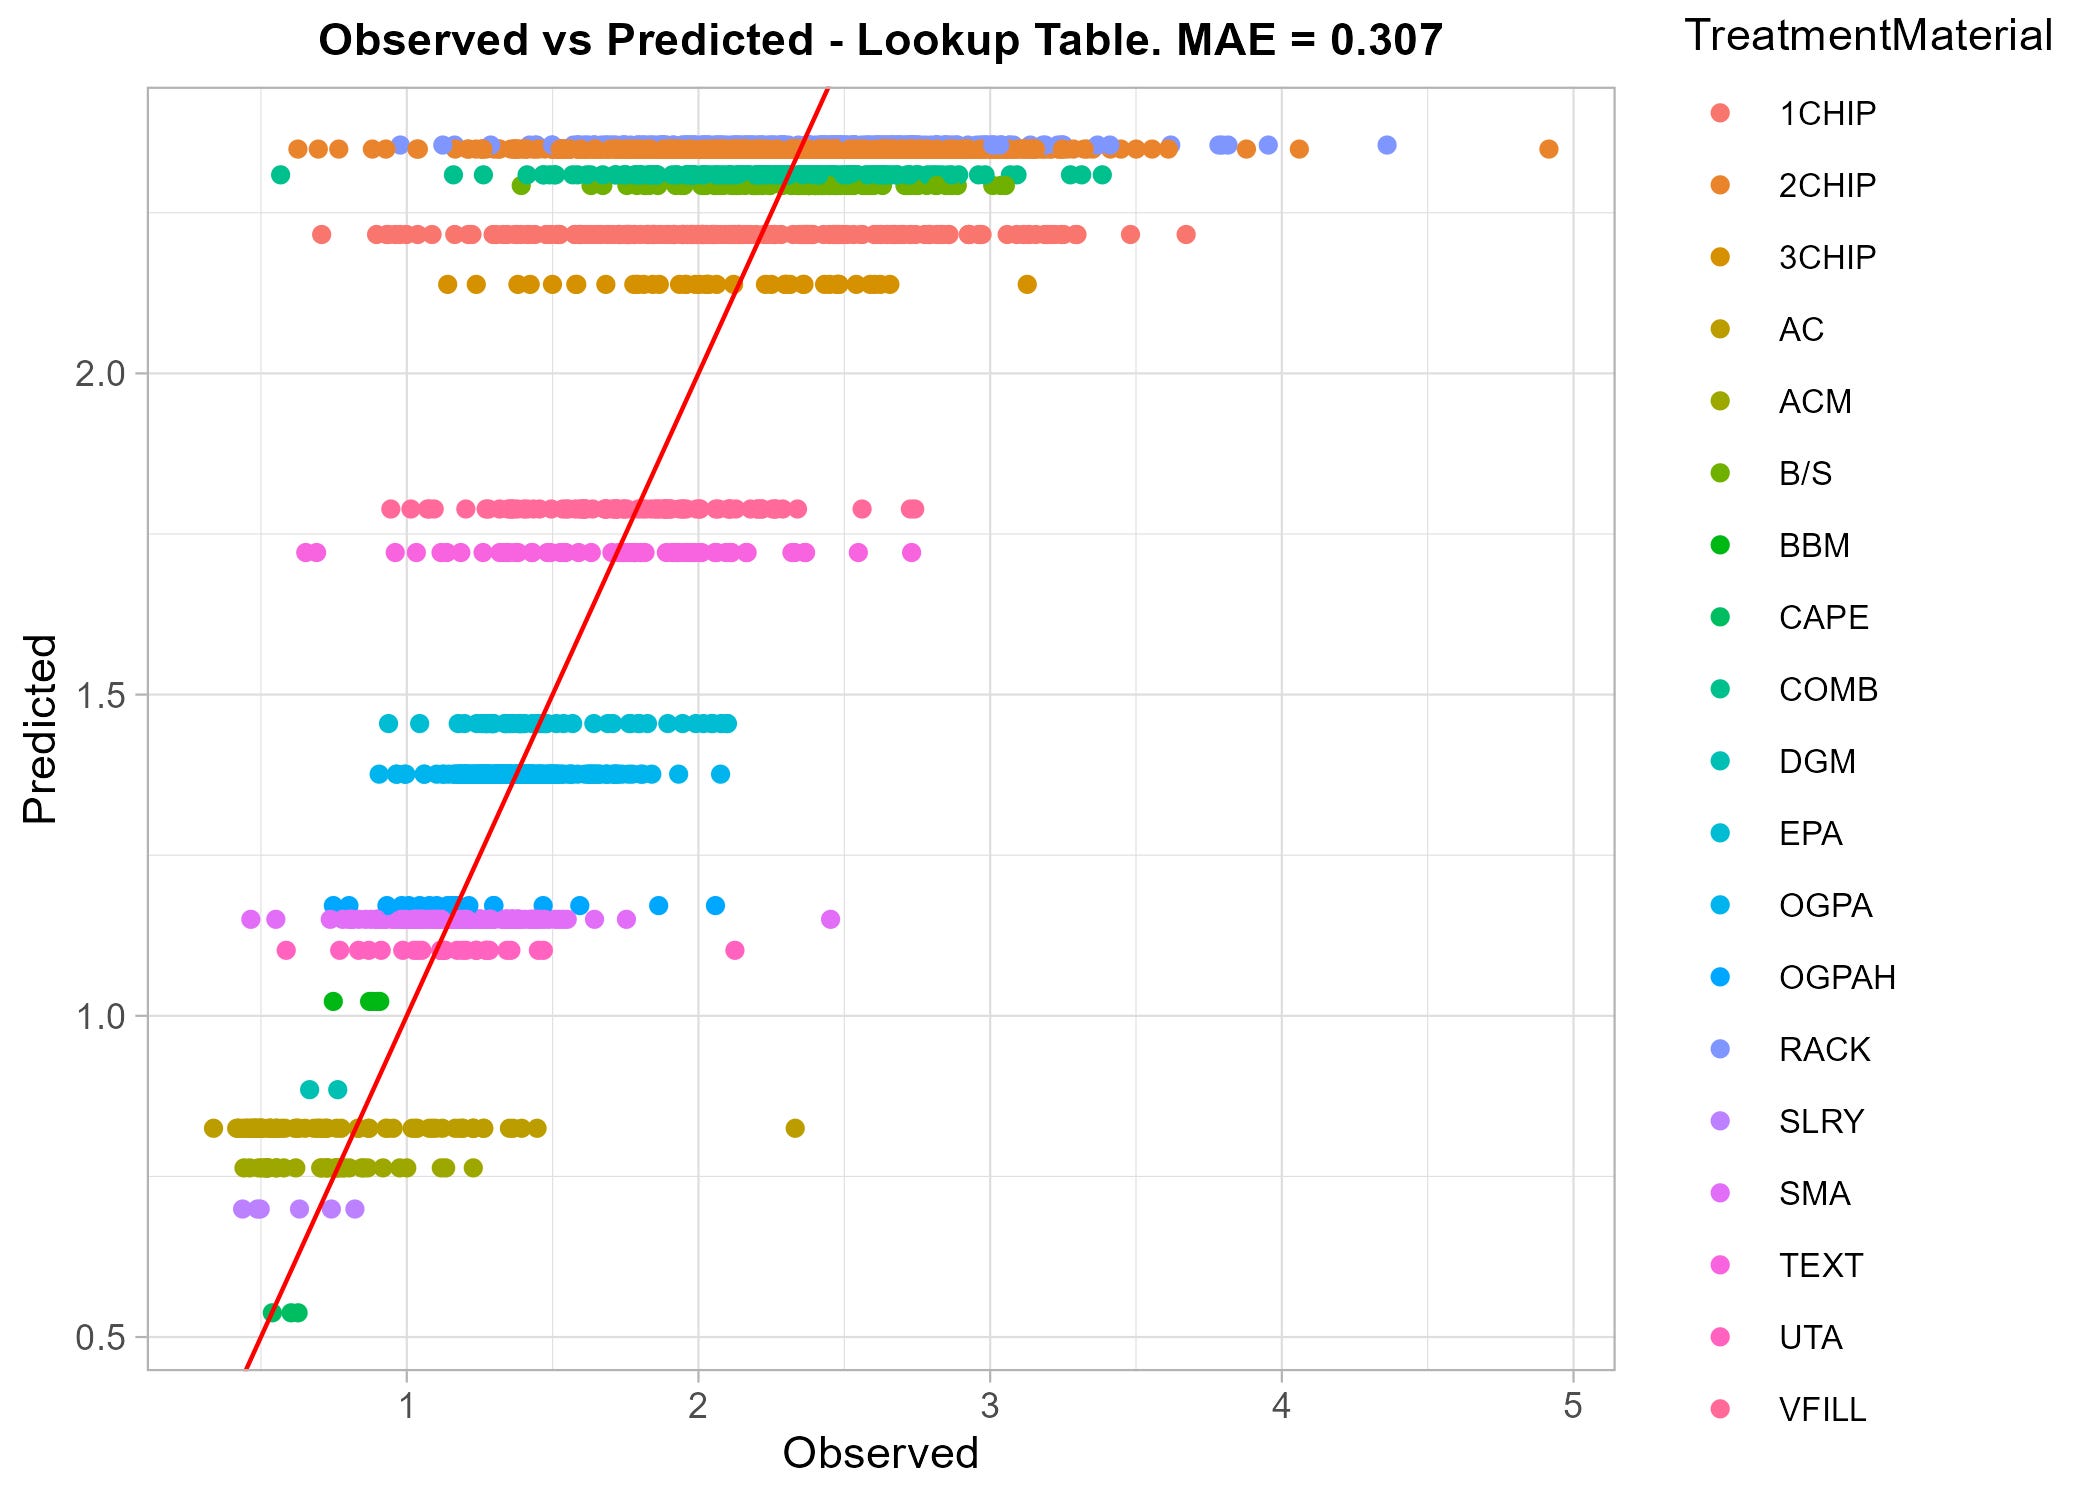
The simple lookup-table model actually performs quite well compared to the Random Forest model, with an Mean Absolute Error of 0.307 mm compared to 0.273 mm for the Random Forest model. Thus the Random Forest model has a slightly better performance, but of course comes with some additional complexity.