
Machine Learning Predictions of Rut Progression
A comparison of Observed vs Predicted values over an 11-year modelling period.

We have been working on testing the outputs from a Cassandra model with Machine Learning (ML) models implemented. Currently I am running Cassandra using an input set based on data collected on the New Zealand State Highways in 2010/11. Then, using this input as a starting point for the model, we forward predict using Cassandra for 11 years until 2021 and compare the outputs with the observed values in each year over the same period.
We then randomly select some treatment lengths, and do a year-by-year comparison of the observed data over this period versus the data predicted by Cassandra using only the 2020/11 data as input.
Any treatments performed over between 2010 and 2021 are entered as committed treatments in Cassandra so that the model can estimate the reset values for comparison with observed values.
The figure below is an example of the comparison we are using - focusing here on the Mean Rut depth on the segment. In this figure, solid orange vertical lines denote a treatment. Dotted vertical lines denote pavement-related maintenance, with the thickness being relative to the cost as shown in the legend. Note that the observed and predicted points for the first year overlap because here the observed data matches the model input set starting values.
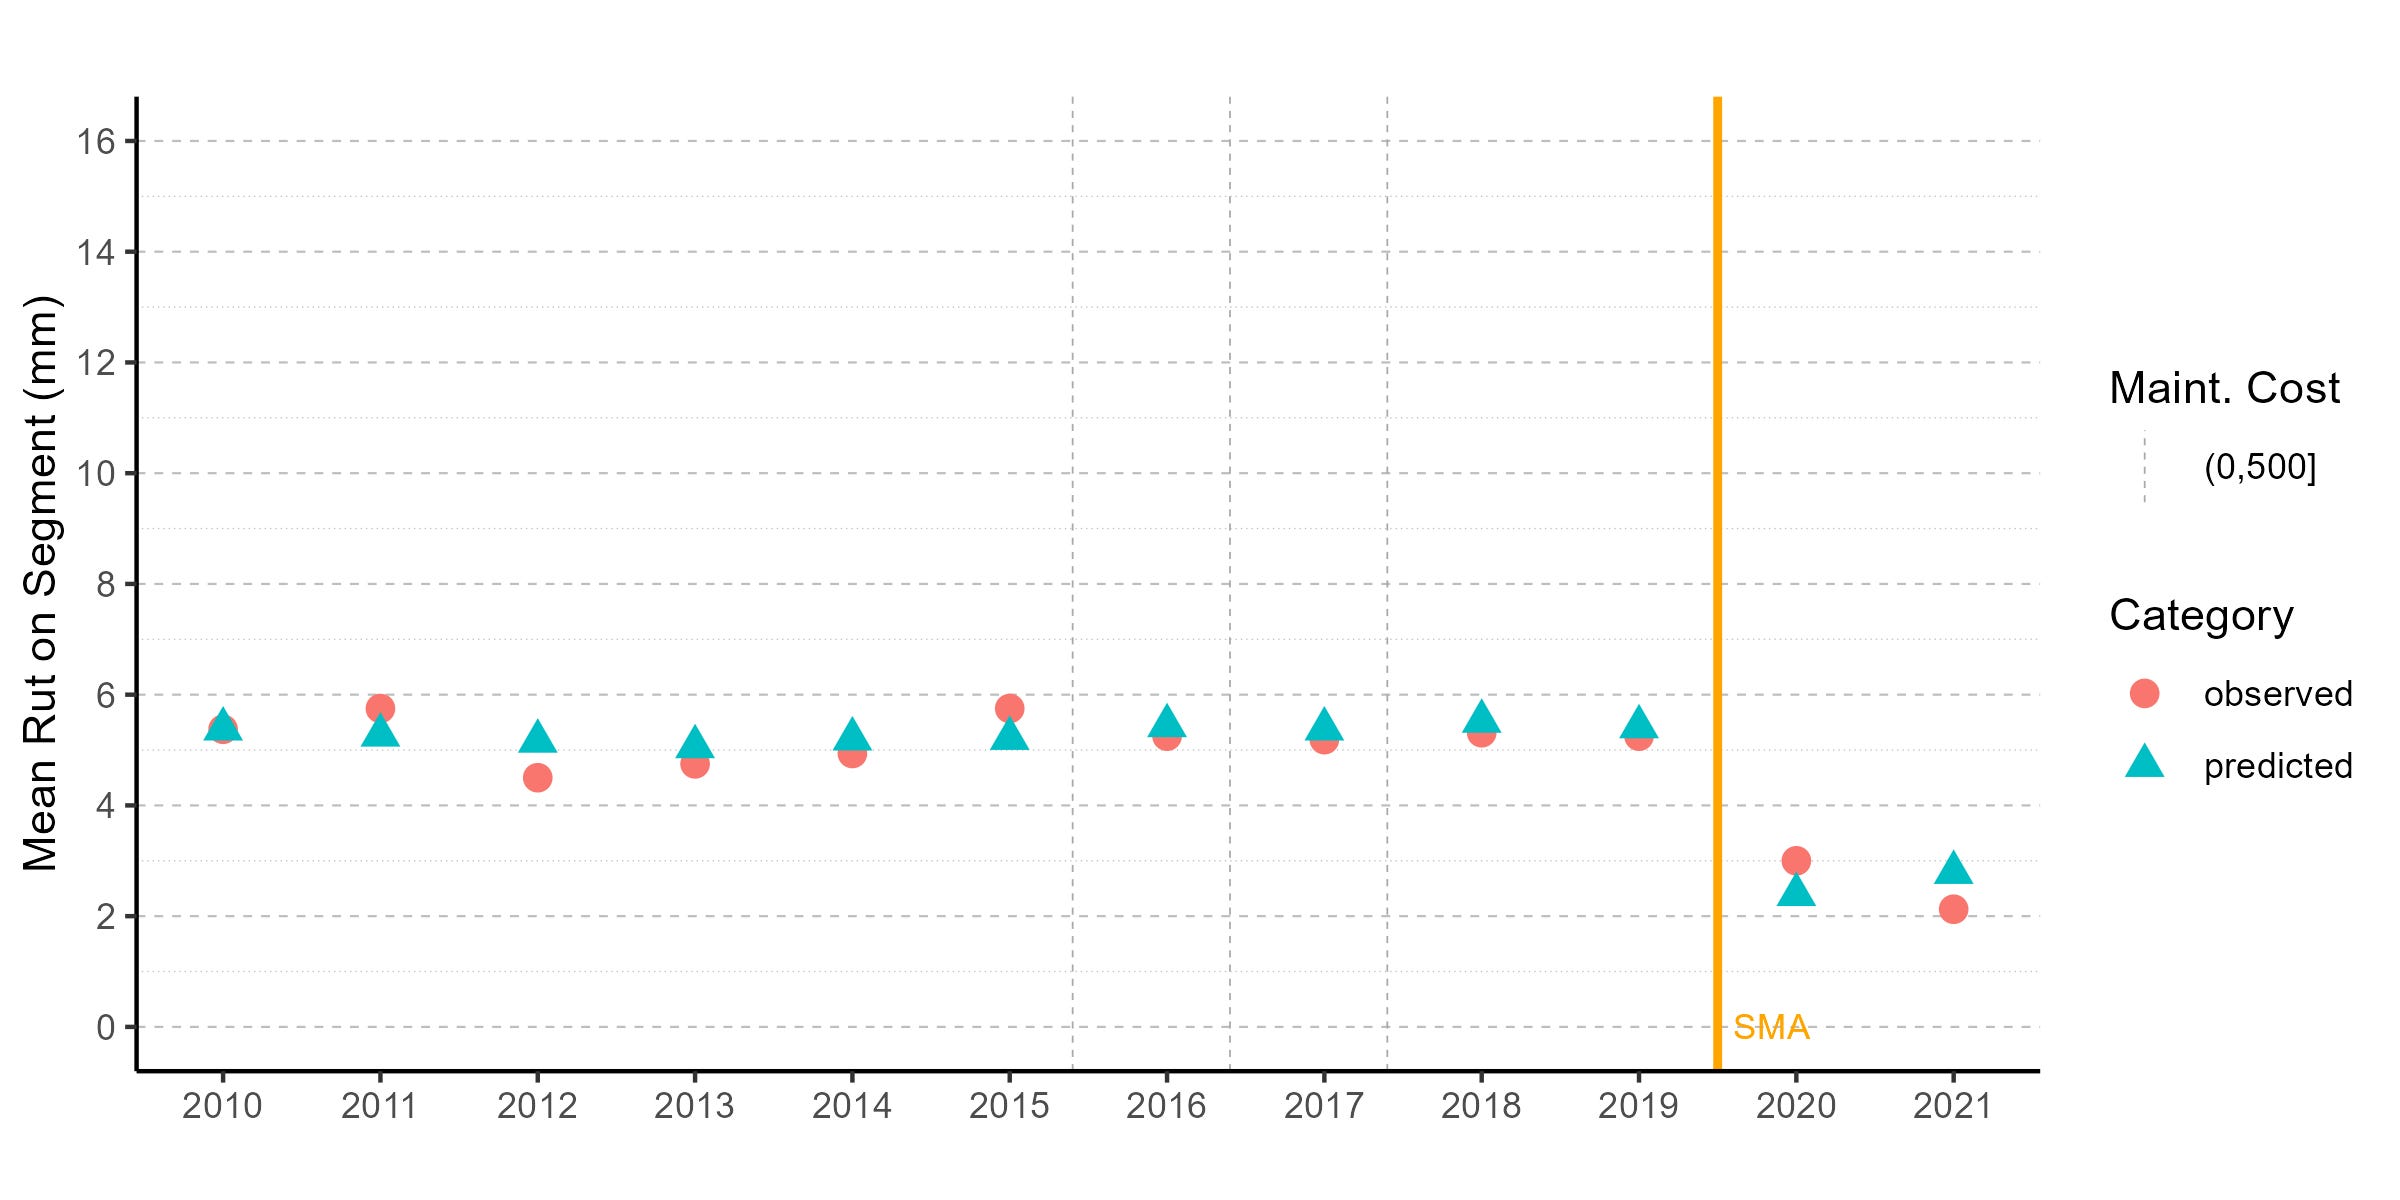
As you can see from the above figure, for this example the ML models perform quite well. The rut rate is predicted with good accuracy. Also, the predicted reset value after the SMA treatment in 2019/20 is within about half a mm of the observed value. As expected, the observed data show more randomness than the predicted data. This is most likely due to random measurement errors or maintenance (potentially undocumented).
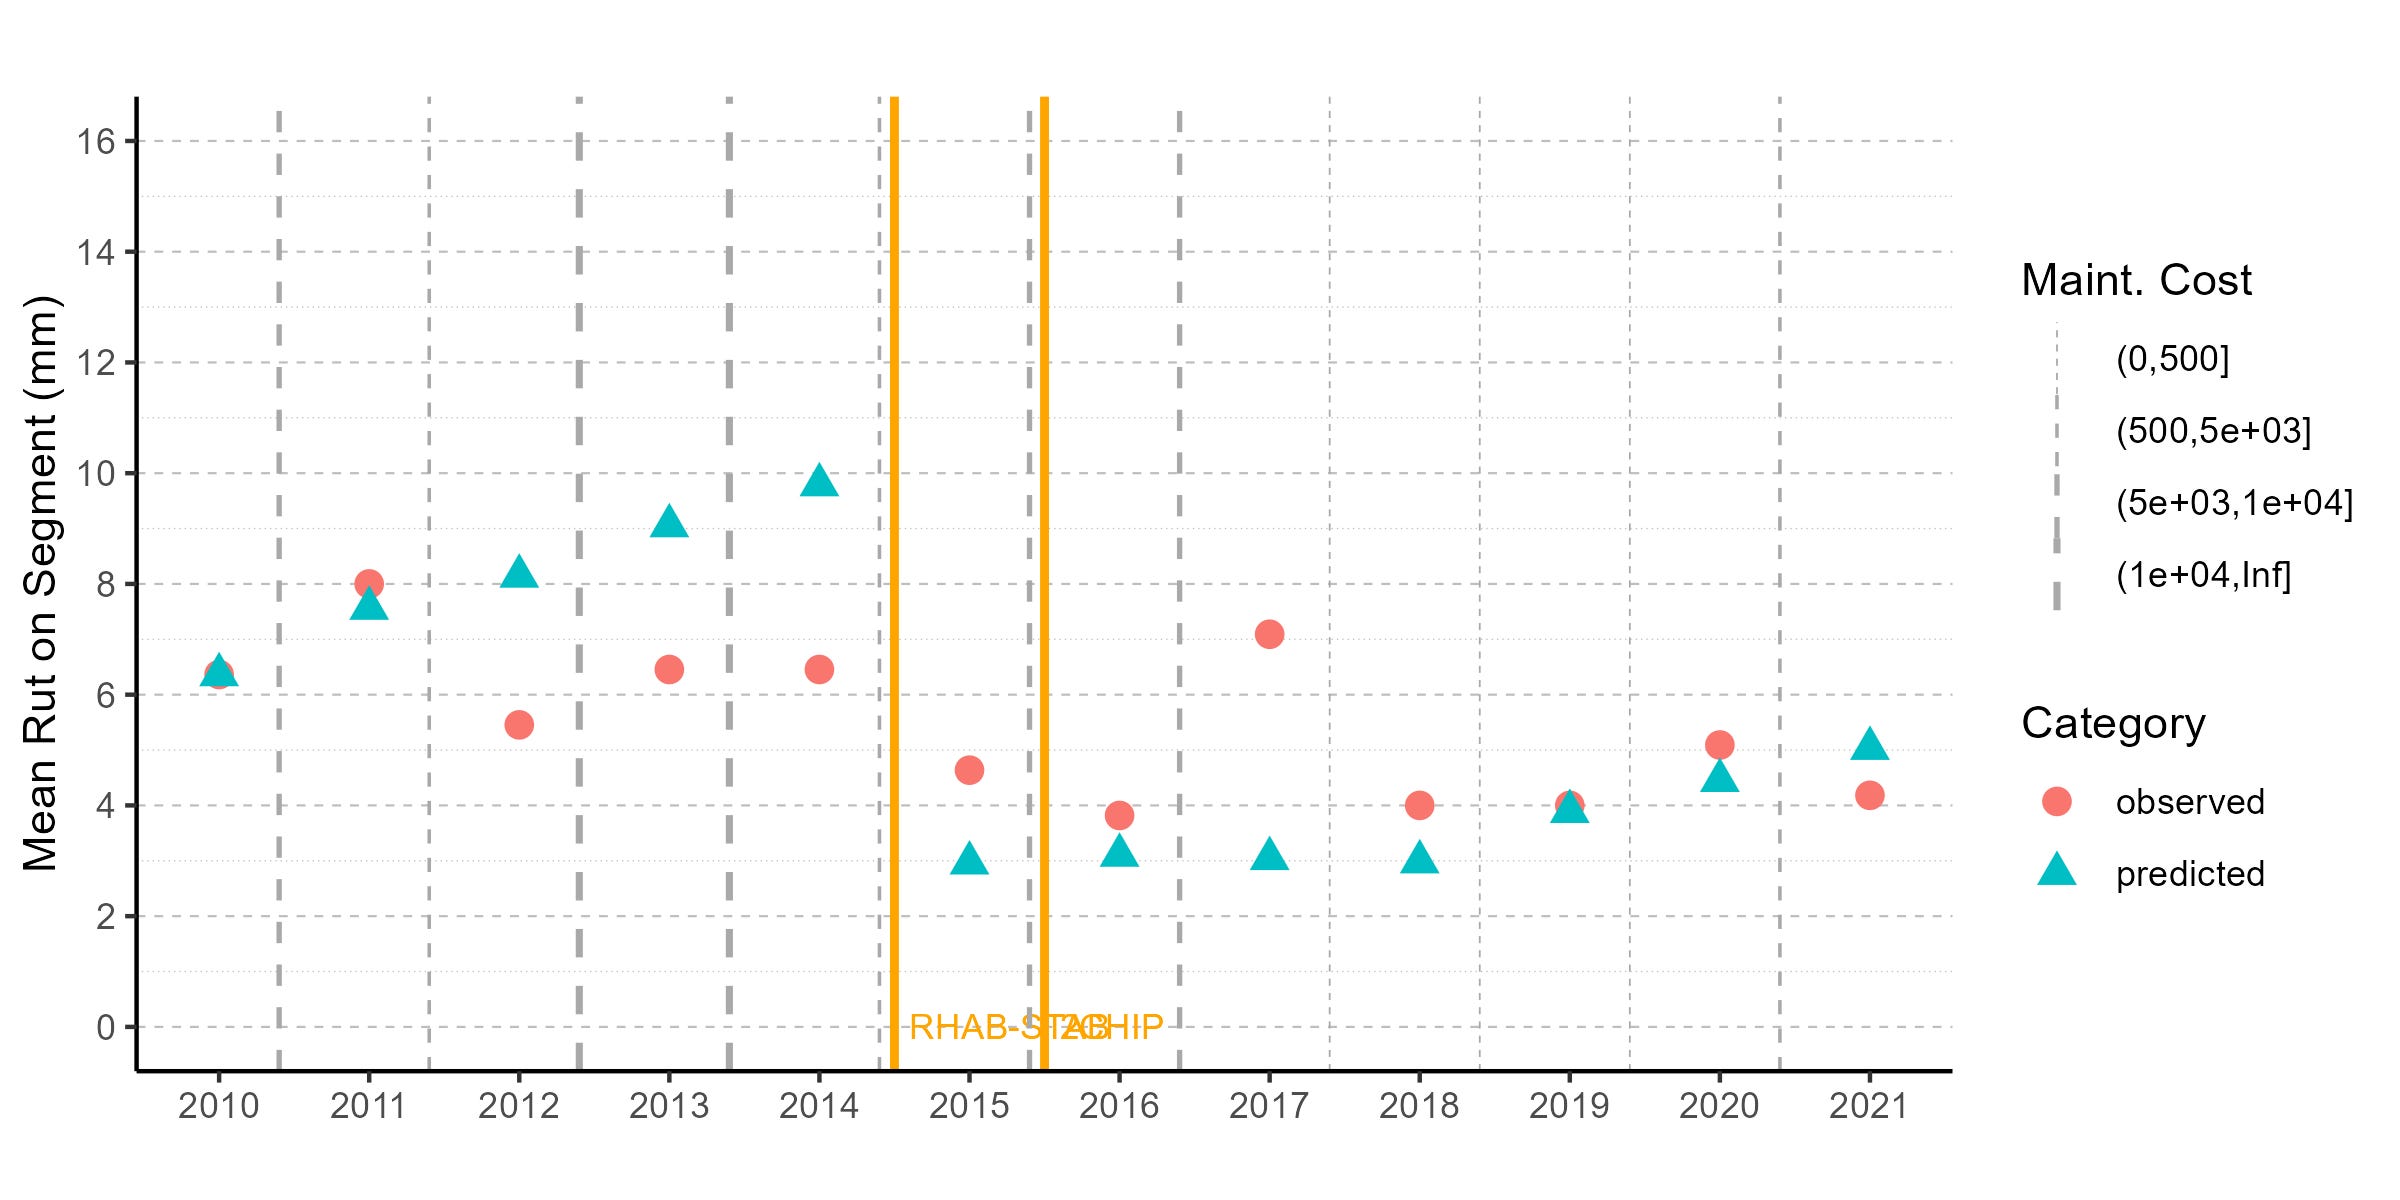
Not all predictions are as good as the one above. Below is a segment where the model initially predicted approximately a correct rut increment (2010 to 2011) but then the observed values were significantly reduced due to maintenance work. As can be expected, the Cassandra model did not reflect this variation (more on this at the end of this post).
After the rehabilitation and second coat seal in 2014/15 and 2015/16, the model prediction is quite accurate with the final predicted value in 2021 being within a mm of the observed value.
Below is another example where the reset after a Combination Seal in 2020/21 was predicted quite accurately. Again, after 11 years of forward prediction, the Cassandra model prediction is within a mm of the observed value. As expected, the observed data shows some random fluctuations that are not reflected in the predicted data.

If you carefully scrutinise the above image you will note that the Cassandra model predicts a negative increment in some years. Here we are still experimenting with some rules. Currently we are trailing a rule that allows for the rut depth to decrease if so predicted, but only if the model also predicts routine maintenance for that modelling period.
The next steps in our journey will be to create a large enough holdout test set for this type of integrated testing and then do a comparison of statistics over all these segments for all modelling years to check for model drift over time. I hope to show you some interesting results in the weeks to come!
Have a good weekend!