
Rethinking Deterministic Forecasting Models
Thoughts about random effects and survival times in road condition data.

Over many years of working with road condition data, I have become accustomed to seeing the following patterns in most forms of these data:
A fair proportion of roads show early failure due to poor construction.
A sizable proportion of roads start showing signs of distress between the ages of six and fifteen years.
A fair proportion of roads do not fall into either of the above categories and can last longer than twenty years before showing signs of distress.
These patterns apply not only to distresses like cracking that initiate at a specific point in time but also to distresses that develop gradually over time, such as rutting. For example, in the case of rutting, we can restate the above as follows:
A fair proportion of roads show a rapid onset of high rutting, with more than 10% of segments showing rutting in excess of 10 mm after three years.
A sizable proportion of roads have rut rates such that after fifteen years, rut levels are in the range of 8 mm to 15 mm (that is, rutting is present and progressing).
A fair proportion of roads have very low rut rates, with less than 8 mm of rut after fifteen years in service.
What this means is that - for some engineering elements such as roads, failure times are multi-modal and highly skewed:
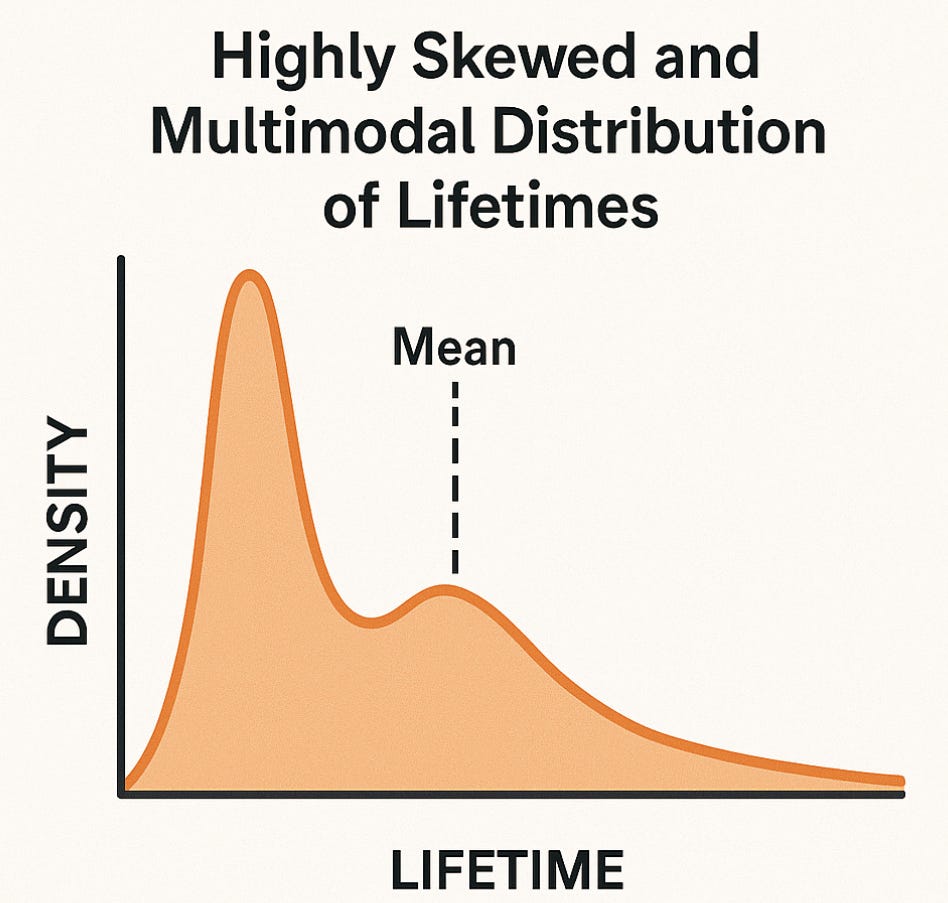
In such environments, the use of mean values - whether in predictive regression models or network performance metrics - are somewhat meaningless. The reasons for this are:
Early failures distort the mean.
A few roads that fail immediately (“early failures”) pull the average downward, even though most units last many years. The mean then misrepresents typical road performance.Long-life components stretch the tail.
Roads lasting more than 20 years extend the upper tail, further inflating or deflating the mean depending on how the data are summarised. The mean then becomes a number that doesn’t correspond to any meaningful operational group.Failure risk changes over time.
The hazard rate (instantaneous probability of failure) is not constant—it’s high early on, low in mid-life, and rises again later. A single average can’t describe such time-varying risk.Design and maintenance decisions depend on the distribution, not the mean.
Engineers care (or should care!) about questions like “What proportion will survive 10 years?” or “When does the failure rate start to climb?”, which require survival or reliability functions, not just a mean.
In short, when failure times span multiple regimes (early break-ins, normal wear-out, and long-lived survivors), the mean time to failure is a poor summary statistic.
Unfortunately, most Infrastructure Deterioration Model implementations use deterministic models that cannot account for this type of randomness in the underlying network behaviour (I alluded to this in an earlier post on this forum).
Because real-world deterioration involves randomness, uncertainty, and multiple possible lifetime deterioration paths, stochastic models (Markov, Monte Carlo, Bayesian reliability frameworks, etc.) are far more meaningful than deterministic ones for both survival and condition-state prediction.
Stochastic models such as Markov and Monte Carlo models preserve variability instead of averaging it away — exactly what is needed for realistic, policy-relevant forecasts.
At Lonrix, we have been pondering these issues for a while in the context of our Juno Cassandra Deterioration Modelling Framework. We are currently working on new model variations to facilitate Monte Carlo or Markov models for long term network performance assessment.
While the technical aspects (coding these models into our framework) are relatively easy to overcome, we are unsure how clients would react to the a model that no longer answers the standard KPI related questions.
Clients accustomed to deterministic models have a familiar set of KPI-related questions. They typically ask things like:
What is the expected life of this pavement type?
When will this road reach condition X?
What will the 75th percentile rut depth be in 2035?
What is the average deterioration rate per year?
These are reasonable questions in a deterministic world—one in which every input leads to a single predictable output. But roads don’t behave that way. In reality, a road network is a stochastic system, full of variability in materials, traffic, environment, construction quality, and maintenance history. Two apparently identical roads can have very different life trajectories.
Once you grasp this, you realise that a shift in thinking is needed. Instead of asking “What will happen?”—which isn’t really answerable in a stochastic system—we move toward questions framed around risk and probability, such as:
What is the probability this section will fall below condition X within five years?
How confident can we be that the current maintenance budget will maintain the network above target condition?
What proportion of roads of this type are likely to need treatment within the next decade?
This shift from certainty to probability doesn’t make the world less predictable—it makes our predictions more honest. It acknowledges that managing infrastructure is as much about managing risk as it is about measuring performance, and that our models should reflect that reality.
As noted above, Lonrix is currently actively working on this problem. We are also considering forming a working group of practitioners and clients to discuss and develop within this space. If you are interested in collaborating with us on this topic so shape policies and deterioration modelling expectations, please get in touch!
Love this piece Fritz! Exactly on the money. We are dealing with living breathing asset in its simpliest form, but with many complex aspects. We (WDC) would be very keen to get on board with bringing this to life in our asset management context.